ESG & Property Insights: Your “E” Sensitivity Training
Climate-change related metrics, such as the intensity of greenhouse gas emissions by property sector, play a role in underwriting. To help commercial real estate market participants factor in those inputs to their underwriting, Green Street published a recent report entitled Property Insights: Your "E" Sensitivity Training, which contains a variety of E – or environmental – metrics normalized across 20 property sectors and 14 countries in the U.S. and Europe. Excerpted below, the Property Insights report assesses the impact of key E metrics on commercial real estate: Emissions/energy intensity, regulations, and grid greenness.
Some key takeaways from the report include:
- Factoring E into CRE underwriting has emerged as an increasingly important valuation input for both private and public investors.
- Most European property sectors are more E sensitive – or greener – due to more stringent regulations on the continent than in the U.S.
- The Data Center and Tower sectors are the most E-sensitive, while the Self-Storage and Manufactured Home sectors are the least E-sensitive.
- However, E sensitivity doesn’t directly translate to proportionate economic costs to owners as tenants may sometimes bear, directly or indirectly, the brunt of the green capital expenditures.
- REIT portfolios are greener than privately held real estate: REIT assets are 60% less energy intensive than the private market average across all sectors and geographies.
Ranking E Sector Sensitivity
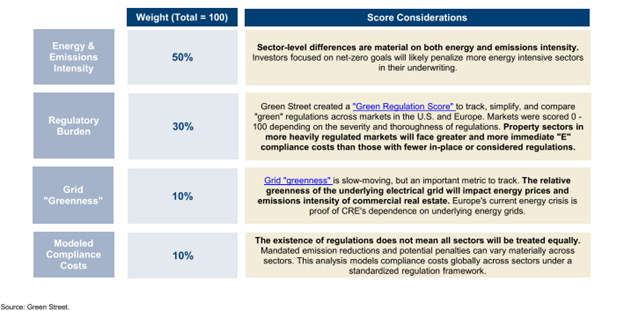
Green Street's approach to rank E sensitivity is to take a variety of inputs, including regulations and emissions intensity, and compare them across sectors with as little subjective input as possible. The weights represent what we consider the most meaningful E sensitivity factors.

Building Type Matters
The differences in emissions intensity across energy grids play a large role in determining property-level emissions. Differences across property sectors arguably matter at least twice as much as differences within property sectors. Green Street previously mapped energy intensity by property sector in the context of higher energy costs, but new data from Measurabl allows for a comparison of emissions intensity as well. The main takeaway: green concerns should matter more for those sectors in the upper right of the chart than those in the bottom left.

Regulatory Burden | U.S. – 30% Weight
Haircuts Needed: Assessing a sector's "Green Regulation Score" requires an examination of the severity of the regulatory framework. The regulatory regime in the U.S. is localized at the state and city level. Overall, using the established frameworks in NYC, Boston, and D.C., the push for emissions reduction suggests 30% emission cuts are needed for the average property sector to avoid fines. That said, certain property sectors are facing larger emission reductions: the office sector, strips, and malls require slightly larger cuts than average.

Regulatory Burden | Europe – 30% Weight
A Nearly Zero World: Assessing Europe-wide regulatory burdens is difficult: national standards vary dramatically in timing, and property sector regulations may not be fully defined. That said, "nearly zero-energy buildings" (NZEBs) standards have been in-place for many countries for some time, which provides a useful framework for judging current building stock versus new requirements. Regional differences appear to matter more than residential versus commercial uses.

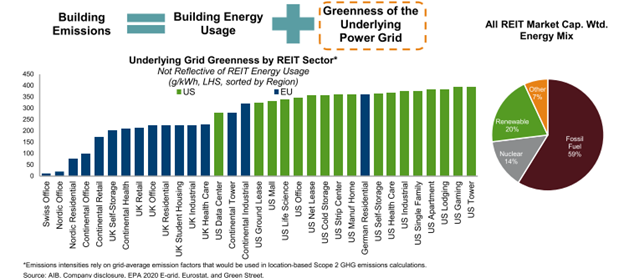
Underlying Grid "Greenness" – 10% Weight
U.S. Worse Off: Estimated REIT sector rollups were calculated based on average emission intensity of the grid. While energy intensity varies by property sector, diversity by underlying energy grids narrows the differences across property sectors. For example, US Data Centers’ global presence hedges the sector's energy exposure. German Residential faces a more pollutive grid, driven by coal usage. Note that this data reflects a REIT's average exposure to market grid emissions intensity and is not reflective of individual REIT’s utility choices and energy usage.

Among other data points, the pages of this report (not included in this blog) drive at the relative positioning of each sector on E sensitivity and especially the economic costs landlords should expect as there isn’t a direct correlation between high emissions intensity and the landlords that will be most negatively impacted economically.
For more insight on the importance of E sensitivity when underwriting properties, join Green Street for a webinar just in time for Earth Day on April 20 at 11 am EDT: The Upside of “E”-Valuating Portfolios Through an Environmental Lens.
Subscribe to Green Street Research and receive a copy of this 25-page report, as well as other pioneering Research reports on the impact of ESG/climate change on commercial real estate: Contact Us | Green Street.
Learn more about our insights
Our thought leadership helps thousands of clients make better investment decisions every day. Inquire here to learn more about Green Street’s product suite.
More Stories
Retail Sector
London's Luxury Retail Playground: The Transformation of New Bond Street
Retail Sector
Measuring Retail Success: Why Floorspace is a key data point?
Retail Sector